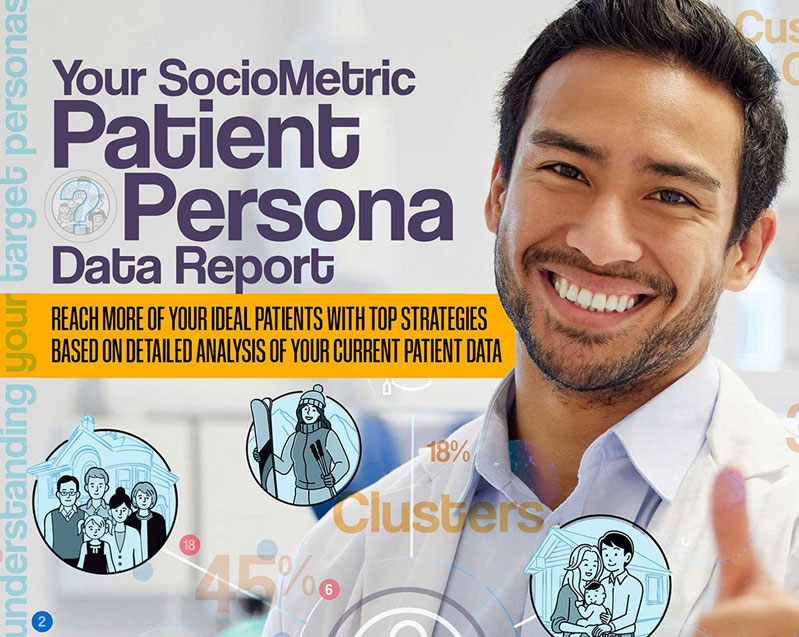
Turning complex patient data into a growth strategy dentists can actually use.
I created a sociometric reporting system that transforms geolocation, lifestyle, demographic, and spending data into clear growth insights for dental practices. Instead of handing clients a pile of raw numbers, I turned the data into a practical decision-making tool for marketing, targeting, and expansion.
Most data reports overwhelm the people who need them most.
Dental practices need better targeting and smarter marketing decisions, but raw demographic tables and endless spreadsheets do not create action. The challenge was to make complex sociometric data readable, useful, and persuasive for dentists and teams who are not data analysts.
Data only matters when it changes decisions.
The real value was not in giving clients more information. It was in translating that information into clear patterns: who lives nearby, how they spend, what lifestyles dominate the area, and which audience segments represent the best growth opportunity. The report had to feel strategic, not statistical.
I built a report system that turns raw consumer and location data into a visual story about opportunity, helping dental practices understand who their best future patients are and how to reach them.
Maps, personas, and insights designed for action.
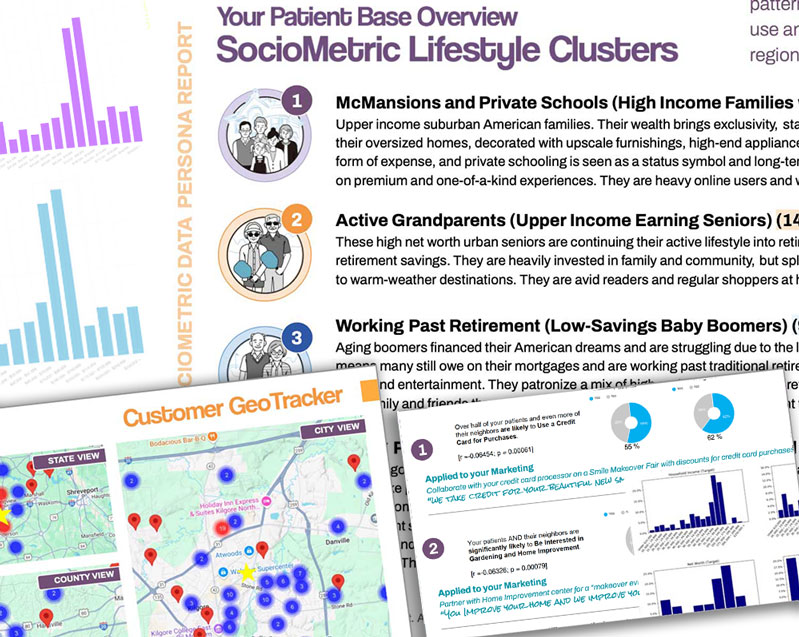
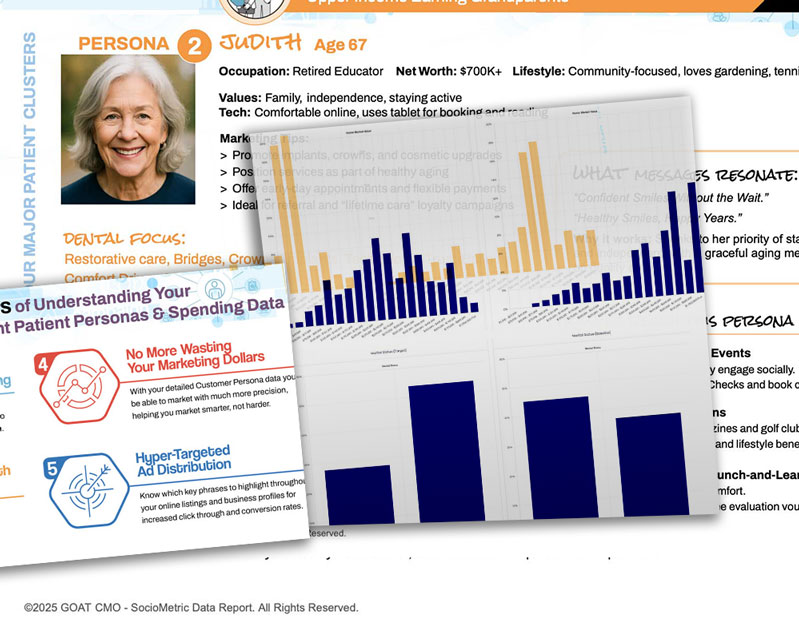
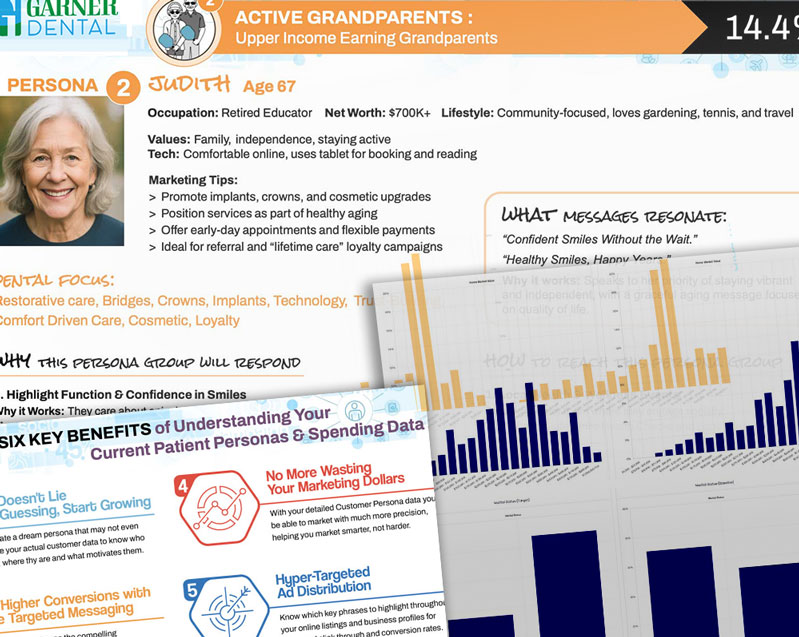
Persona clusters
The report grouped households into understandable lifestyle segments, giving practices a more human view of their local market.
![]()
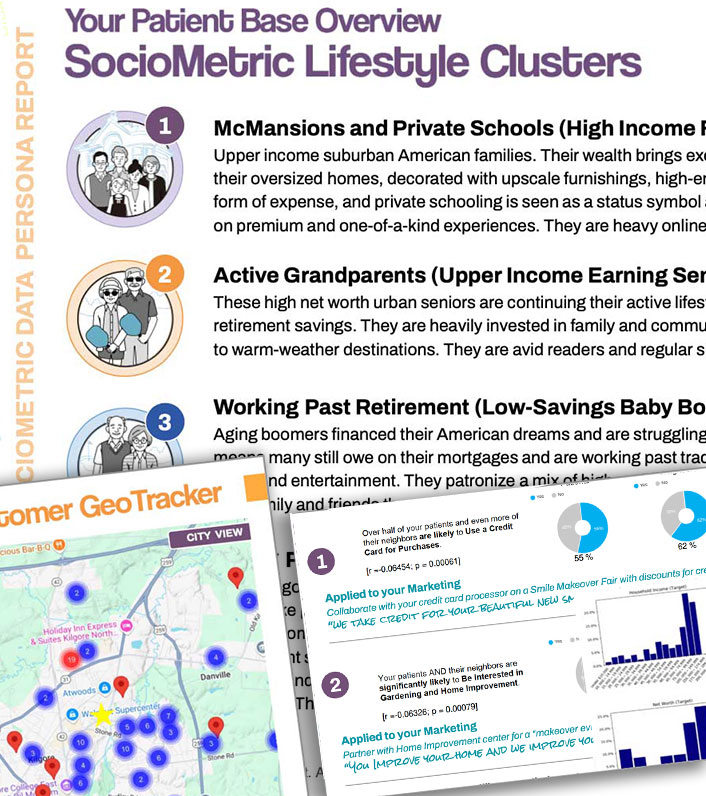
Location intelligence
Maps and radius-based visuals helped practices see where ideal patients live, where opportunity clusters, and where outreach should be focused.
Actionable recommendations
The final report moved beyond charts and translated the findings into concrete targeting, messaging, and market-growth recommendations.
The best data is the data a client can actually act on.
By structuring the report around clarity and strategy, I turned dense market information into a tool that helps practices make smarter decisions about growth, outreach, and positioning.
What the report delivered.
Clearer audience targeting
Practices could identify which nearby household groups were the best fit for their services and marketing focus.
Better geographic focus
Maps and market visuals made it easier to prioritize neighborhoods, zip codes, and radius-based campaigns.
More strategic marketing decisions
The report connected demographics and spending habits to real recommendations, not just passive information.
Higher perceived value
Presenting the data as a polished strategic tool elevated how clients experienced the insight and the service behind it.
Because it translated data into confidence and action.
It simplified complexity
The report made dense consumer and market data easier for non-technical clients to understand and use.
It visualized opportunity
Instead of abstract numbers, clients could see where growth lived and which segments were worth pursuing.
It supported better decisions
The work bridged the gap between analysis and implementation, making the report a real business tool.
It elevated the service offering
The clarity and polish of the report made the underlying strategy feel more premium, credible, and useful.
A smarter way for dental practices to see their market.
The sociometric report turned overwhelming information into a strategic asset, helping practices better understand their audience, sharpen their marketing, and make stronger growth decisions.
Good data informs. Great reporting persuades.
This work turned data into a story clients could understand, trust, and act on.